AIR QUALITY DASHBOARD
Allegheny County, PA :: Pittsburgh Region
Last 72 Hours, Quick Reference:
AQI
EnviroDylos w/Regional PM2.5
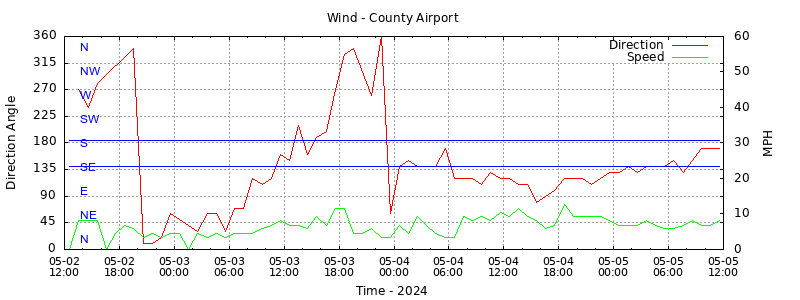
Wind
EnviroDylos CO2
Dylos Comparison
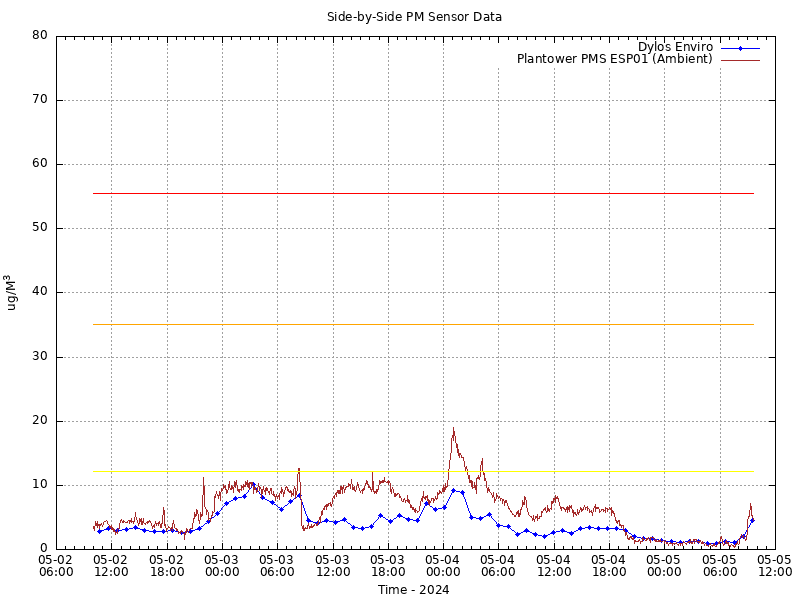
PM Sensor Comparison
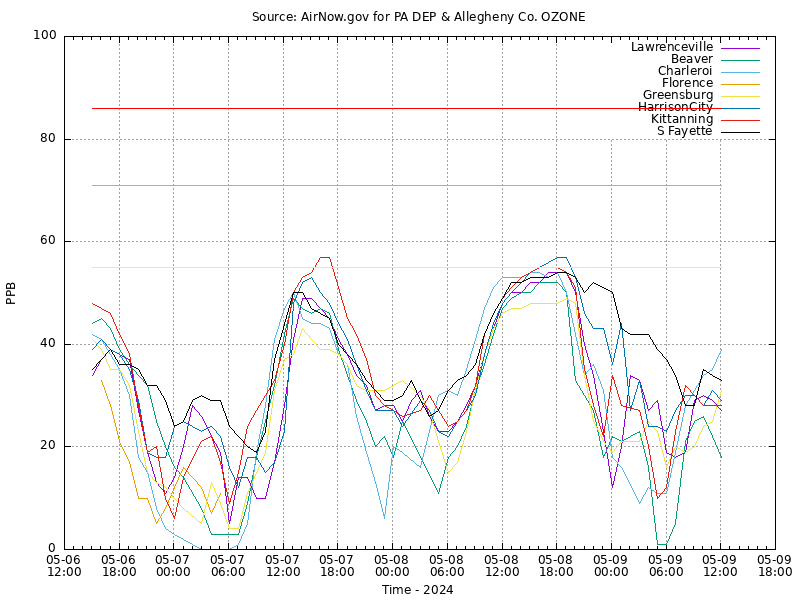
Regional Ozone
Experimental VOCs
Experimental NO2
Experimental H2S
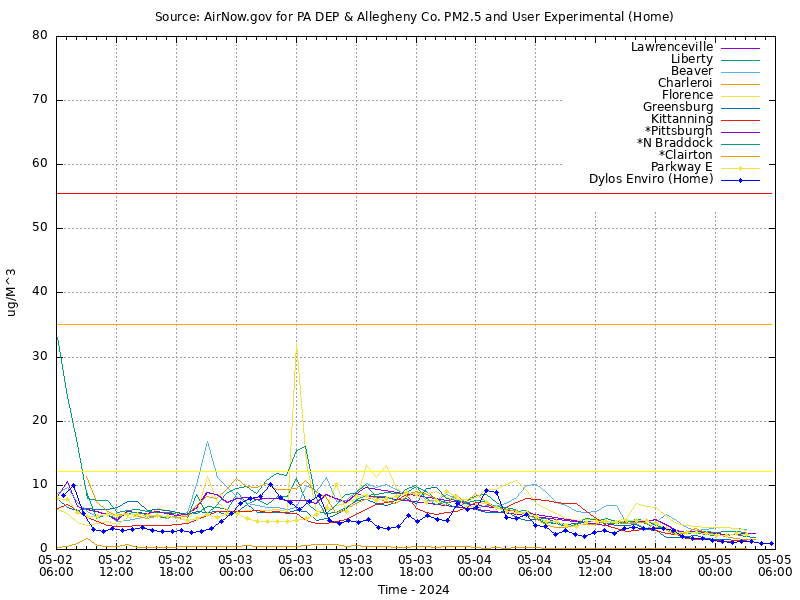
These are dynamically generated plots primarily for Fine Particlate Matter that compares regional air monitor sites and the EnviroDylos, an environmentally maintained enclosure for a Dylos DC1100, Fine Particulate Counter, from which to sample outdoor ambient air.
Regional PM2.5 levels posted to AirNow.gov along with the EnviroDylos.
|
|
Latest Climatic Conditions - KAGC
(Dir)|(Time)|(Speed)|(Angle)|(tF)|(%RH)
angle value of 999 = shifting winds
|
Last Wind Update
no pointer = shifting winds
or no wind
|
AM Surface Inversion
at PIT [72520]
07:00 EST Sounding
(Date)|(tC)|(hM)
≥ 5.0° C is considered a 'Strong' Surface Inversion per ACHD-AQ.
|
Plumage Direction
Critical Contributors
|
EnviroDylos Ambient/Outdoor CO2 Level (CO2meter's SenseAir-K30 Sensor)
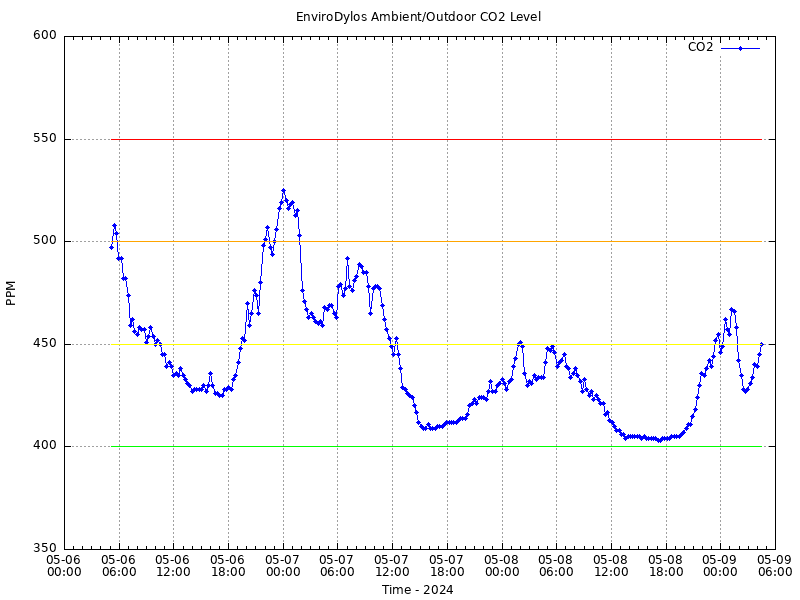
Surface Inversion, Stagnant Air Indication
|
EnviroDylos Ambient/Outdoor VOC Level (Sensirion SGP30), AMS CCS811 testing discontinued
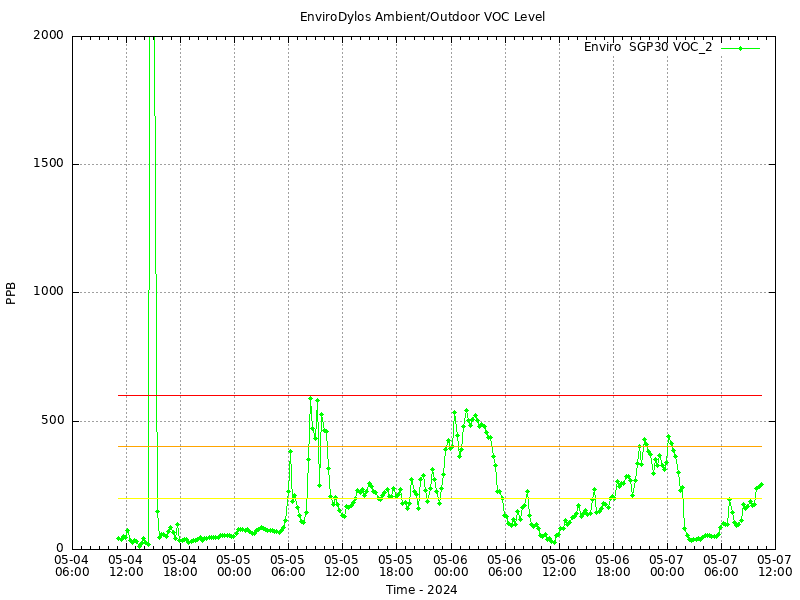
Preliminary - Experimental
|
Ambient/Outdoor NO2 Levels (SPEC Sensors Digital Gas Sensors for IOT)
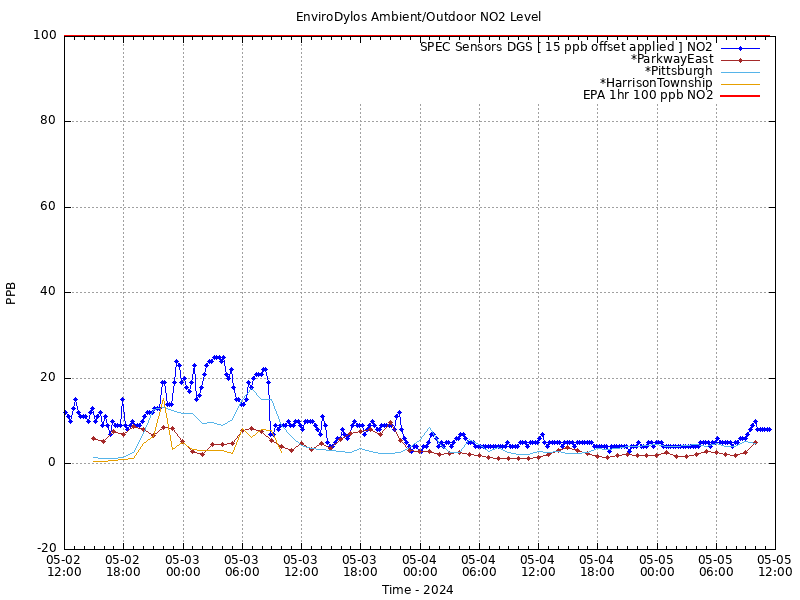
Preliminary - Experimental
|
Ambient/Outdoor H2S Levels (SPEC Sensors Digital Gas Sensors for IOT)
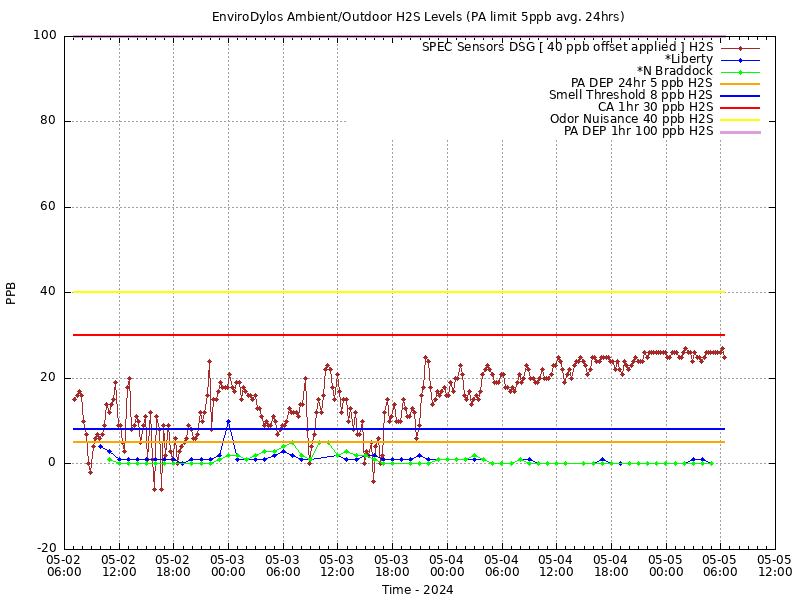
Preliminary - Experimental
|
Local Mixing Height(Weather.gov NOAA)
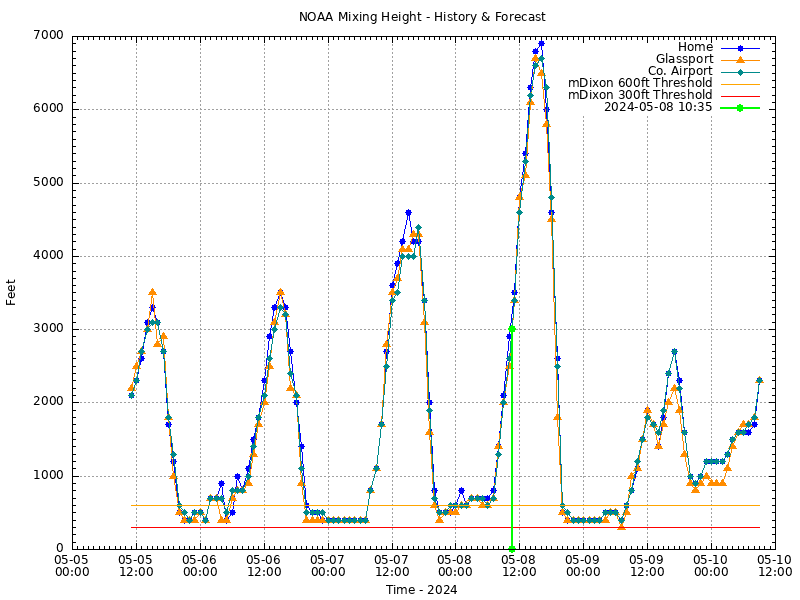
Likelyhood of Pollutants Building up at Ground Level, Not Venting to Atmosphere
|
Difference between the EnviroDylos and a stand-alone Dylos (Ambient).
(stand-alone Dylos, provided courtesy of the CMU CREATE Lab
and the Breathe Project)
[Ambient Dylos Is No Longer Operational.]
|
Some PM sensors and the EnviroDylos.
|
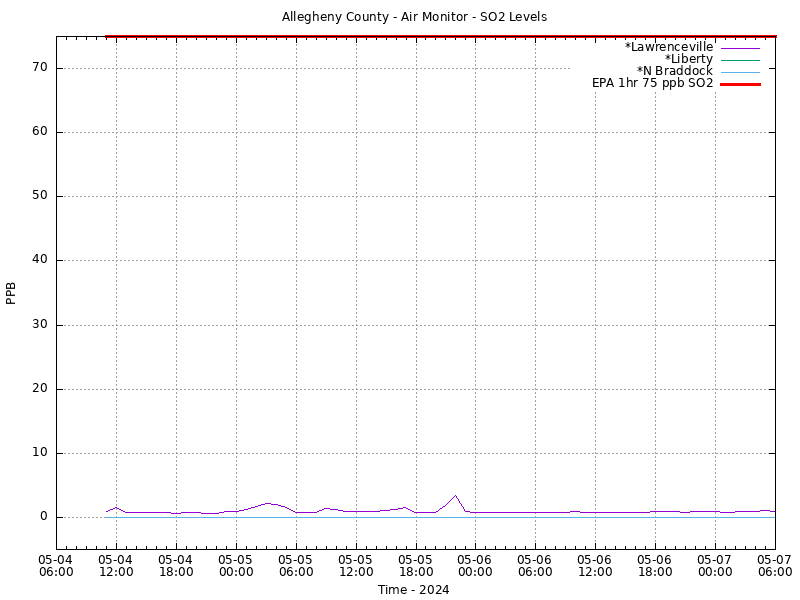
Allegheny County SO2
|
Regional Ozone levels posted to AirNow.gov
|
For reference, this is a time line for the "Current" reported AQI values posted by AirNow.gov
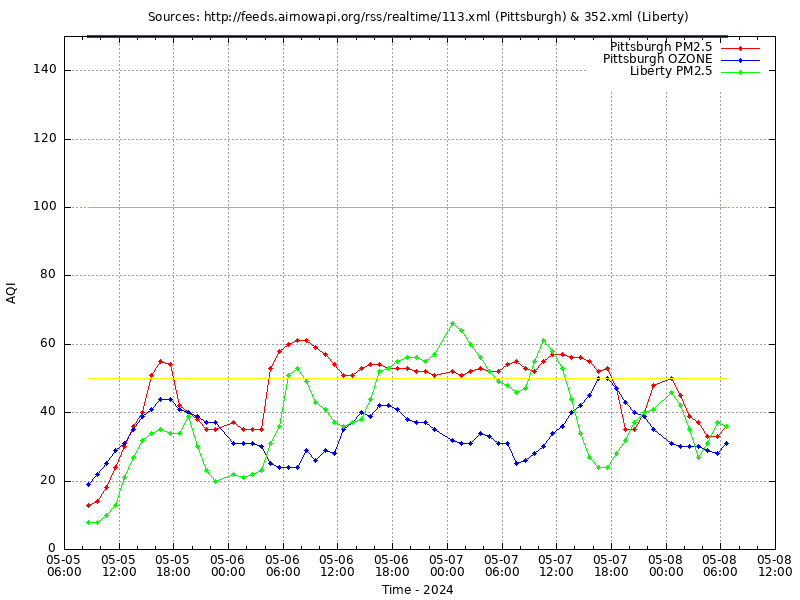
Liberty is seperated from the Pittsburgh AQI calculation.
Often times a new hourly AQI value is not provided during the early morning hours.
As such, data points have been added to help show missed updates.
|
Public data pulled from the AirNow.gov API server. Reference: www.AirNow.gov
For more information about the EnviroDylos, go to: home.crHARPER.com/EnviroDylos
Project Inspiration:
In October of 2014, I was perplexed by our region's air quality while observing
some of the very localized smog, more politely referred to as 'haze' by our
local television 'celebrity' weather 'prognosticators'. I then started taking
an active interest in the AirNow.gov web site but found that there was no way
to view and review PM2.5 fine particulate levels occurring just a few hours prior.
It seemed obvious that for future reference, data collection would be necessary
and a simple plot consisting of all the regional AQ monitor sites overlaid on a
single time line would be an easy way to get a clearer understanding of what
goes on with our region's inconsistent air quality levels. It is from that need,
this basic web page was initially created.
Shortly after that, the need to create an environmentally controlled chamber
for my Dylos DC1100, purchased in November of 2014, became clearly evident.
And from that, I was then able to record far more reliable fine particulate
data beginning in January of 2015.
Regarding the EnviroDylos, there are good arguments for not eliminating the
fine water and ice particles from Dylos readings because many consider that
the sources of these, thought to be interfering, particles most likely originate
from industrial sources in our region and are potentially toxic. A perfectly
valid viewpoint, but for this project, I want to provide conservative and
comparable particulate values, that over time, show to be very much like
that reported by the County and DEP instrumentation.
Project Evolution:
* NOV 08, 2014 - Pittsburgh AQI values pulled from AirNow.gov
* NOV 10, 2014 - county PM2.5 data pulled from AirNow.gov
* NOV 12, 2014 - county airport weather data pulled from Weather.gov
* NOV 14, 2014 - DEP PM2.5 & Ozone data pulled from AirNow.gov
* NOV 14, 2014 - placed order for a Dylos DC1100
* NOV 22, 2014 - noted highway small particle counts were in the 2000s
* DEC 04, 2014 - noted very high outdoor particle counts atributed to frozen water particles
* DEC 11, 2014 - logging outdoor Dylos, w/frozen water particles
* JAN 05, 2015 - EnviroDylos operational
* JAN 08, 2015 - added second Dylos as ambient reference
* MAR 11, 2015 - added Liberty to AQI plot
* AUG 24, 2015 - added county airport wind data reference
* SEP 09, 2015 - added wind plot
* OCT 28, 2015 - real time data upload to the CREATE Lab's Environmental Sensor Data Repository
* FEB 27, 2016 - Parkway East added to PM plot, a new county monitor added in late 2015
* JUL 27, 2016 - CO2meter's SenseAir-K30 CO2 sensor added to EnviroDylos
* SEP 05, 2016 - added AM surface inversion
* SEP 17, 2016 - added CO2 channel to EnviroDylos, real time ESDR upload
* MAY 07, 2017 - evaluating a low cost VOC sensor
* JUN 07, 2017 - added VOC channel (CCS811) to EnviroDylos, real time ESDR upload
* JUN 08, 2017 - hosting an Awair for ESDR upload (discontinued)
* AUG 10, 2017 - added Mixing Height Forcast plot, date from NOAA
* APR 28, 2018 - Testing secured MQTT sensor data transfer as this has become very popular for the IOT
* JUN 27, 2018 - added second VOC channel (SGP30) to EnviroDylos, real time ESDR upload
* JUN 27, 2018 - added HTU21D to replace One-Wire T/RH hardware
* SEP 21, 2018 - evaluating two SPEC Sensors, NO2 and H2S
* MAR 14, 2019 - added low cost PM sensor comparision, with Honeywell and Plantower
* SEP 17, 2020 - repackage county AQ data to be user friendly: achd.crharper.com (updated hourly)
* XXX YY, ZZZZ - What next? A proper LoRa Gateway possibly
If all is working correctly, plots are updated hourly.
Manual page refresh required.

|